Office of Management and Budget
Section 12 · Pages 68–75 · 4 tables · includes narrative
Key changes
- Budget increases 32.0% ($7.5M)
On this page
Office of Management and Budget
 Office of Management and Budget
Mission
The mission of the Office of Management and Budget ("OMB") is to ensure the effective and efficient use of available resources in order to sustain the delivery of quality services to the residents of the City of Pittsburgh.
Departmental/Bureau Overview
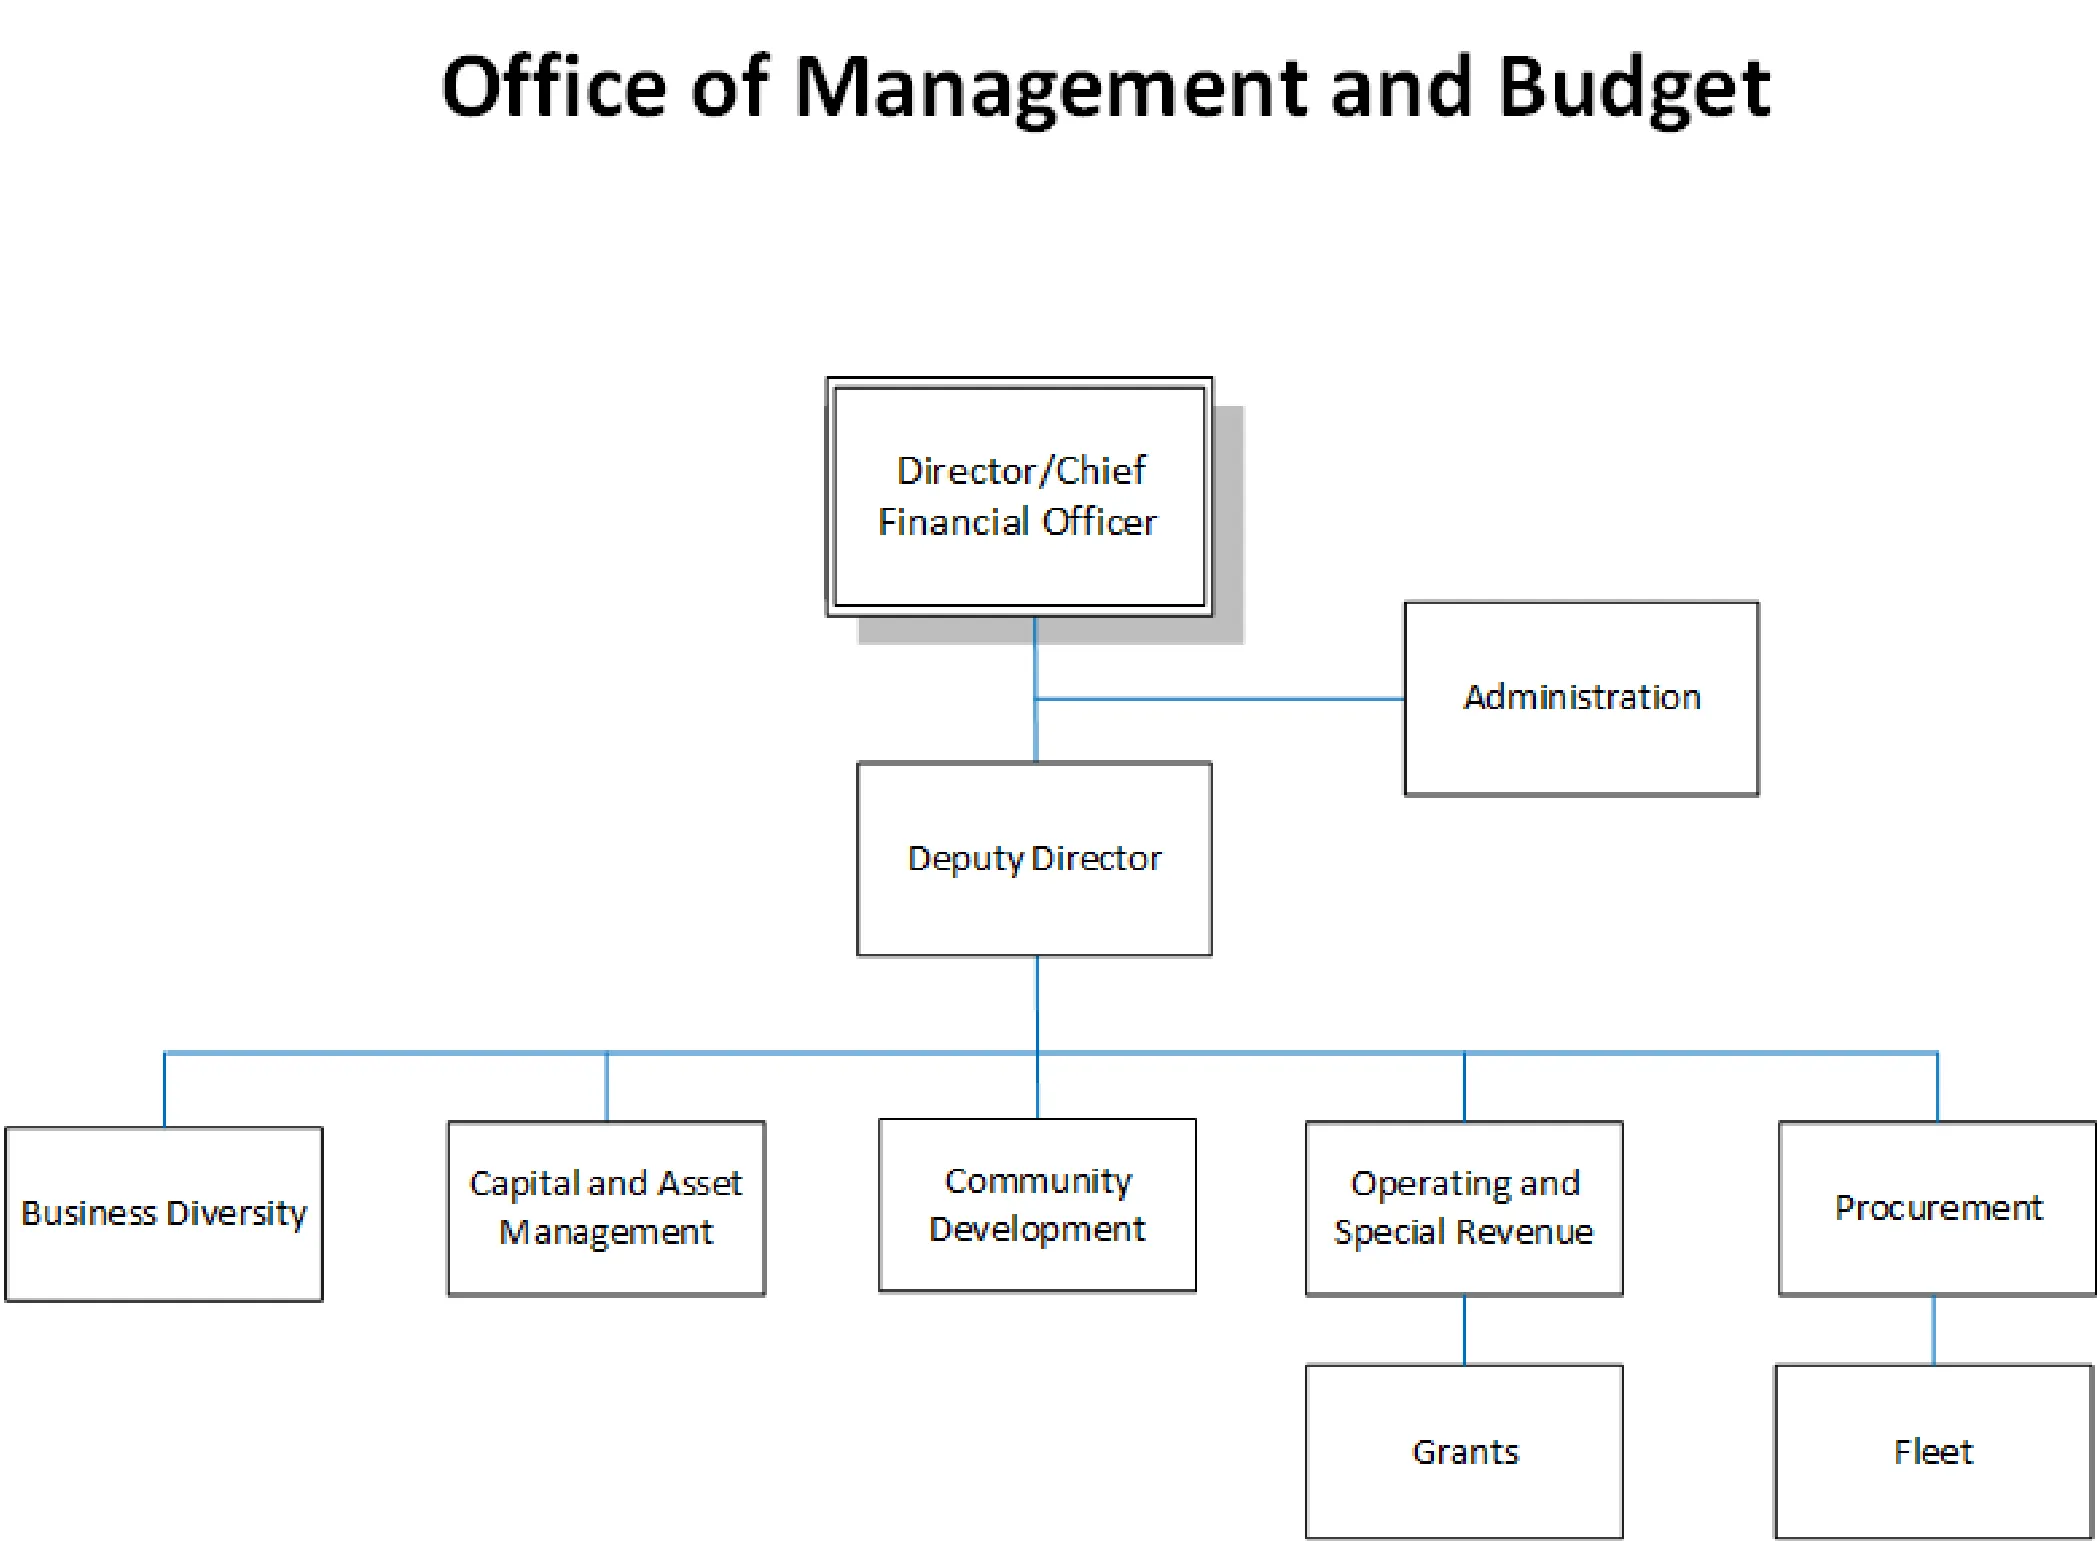
The Office of Management and Budget is organized into the following core teams to strengthen citywide financial and grant management: Management - This team provides overall leadership and direction for the City and oversees departmental planning and management functions.
Business Diversity - This team, along with the Equal Opportunity Commission, works toward equitable and diverse participation in City procurement by promoting opportunities for minority-, women-, veteran-, and LGBTQ+-owned businesses and pursuing City contracting goals. They hold an annual Procurement Fair for small and medium businesses and organizes capacity-building initiatives, including workshops and making connections to financial, marketing, technical, and AI-based productivity resources on an ongoing basis. They also engage with local organizations and authorities to raise awareness and increase local business involvement in City procurement.
Capital and Asset Management - This team is responsible for the preparation and implementation of the annual capital budget and six-year capital improvement program; planning and administration of the City’s asset management function; and the development and financial oversight of the City’s long-term infrastructure investment plan.
Community Development - This team coordinates programs that provide the City with resources to address a wide range of unique community needs. The primary goals of the Community Development Division are to improve housing conditions; foster community and economic development; improve public facilities; and improve and enhance the quality of life for residents of the City of Pittsburgh, most specifically those with low-income. These initiatives are funded by the U.S. Department of Housing and Urban Development and include the following programs: Community Development Block Grant ('CDBG"), Home Investment Partnership ('HOME"), Emergency Shelter Grant ("ESG"), and Housing Opportunities for Persons with AIDS ("HOPWA").
Operating and Special Revenue - These teams are responsible for the preparation and implementation of the annual operating budget and five-year forecast; long-term financial planning; financial policy development; maximizing opportunities to pursue, secure, and effectively administer grants from federal, state, county, corporate, and foundation partners; leading the transformation of the City’s finance functions, talent, processes, and technologies; and the management of enterprise-wide projects that will have a significant financial and/or operational impact. The Grants Office is housed within this group.
Procurement - This team is responsible for organizing and directing the day-to-day operations of the procurement function; driving improvements in procurement processes, policies, and technology; and implementing cost management initiatives related to procurement, warehousing, and inventory management.
2026 Accomplishments
Operating and Capital
- Held 4 budget engagement meetings across the city
- Utilized the annual Controller's Close process to reallocate $78,090.34 in dormant capital funds to augment the 2026 street resurfacing program
- Reallocated remaining 2019 CDBG funds ahead of the eight‑year HUD deadline by aligning financial resources with current and ongoing project needs to ensure complete spend down
Grants
- Helped secure over $25 million in external funding, including $21 million through 41 grants and $4 million in donations, supporting major capital investments such as the Boulevard of the Allies redesign and Fort Pitt Park renovation in Garfield. Community Development
- Successfully expended all remaining CDBG-CV funds
- Hosted the 57th Annual National Community Development Association summer conference, bringing over 350 visitors to Downtown Pittsburgh
- Adapted programming to remain in compliance with evolving federal regulations Business Diversity
- More than 150 people attended the 2026 City of Pittsburgh Procurement Fair, connecting businesses with procurement opportunities and business development recourses
- The City is exceeding the 20% MWDBE participation on City contracts reviewed by the Equal Opportunity Review Commission (EORC) Procurement
- Supported the acquisition of 13 new fire apparatus through a competitive RFP process, including eight pumpers and five aerial ladder trucks
- Advanced efforts to modernize the City's vendor performance management system in partnership with the Mayor's Office and Partners for Public Good, with an estimated project completion and implementation in 2027
Position Summary
Lists authorized positions with FTE counts and pay grades.
| Title | 2026 FTE | Rate/ Grade | Hours/ Months | 2026 Budget | 2027 FTE | Rate/ Grade | Hours/ Months | 2027 Budget |
|---|---|---|---|---|---|---|---|---|
| Director, OMB/Chief Financial Officer | 1 | 133,827 | 12 | 133,827 | 1 | 137,842 | 12 | 137,842 |
| Deputy Director, OMB | 1 | 33G | 12 | 120,827 | 1 | 33G | 12 | 124,446 |
| Executive Assistant, OMB | 1 | 21G | 12 | 73,258 | 1 | 21G | 12 | 75,462 |
| Budget Accounts/Technician | 1 | 17G | 12 | 61,922 | 1 | 17G | 12 | 63,773 |
| Fiscal and Contracting Coordinator | 1 | 59,445 | 12 | 59,445 | 1 | 61,229 | 12 | 61,229 |
| Assistant Director - Capital & Asset Management | 1 | 32G | 12 | 114,046 | 1 | 32G | 12 | 117,458 |
| Manager, Capital Budget | 1 | 28G | 12 | 97,656 | 1 | 28G | 12 | 100,589 |
| Budget Analyst | 1 | 22G | 12 | 76,294 | 1 | 22G | 12 | 78,582 |
| Assistant Director - Operating & Special Revenue | 1 | 32G | 12 | 114,046 | 1 | 32G | 12 | 117,458 |
| Senior Budget Analyst | 2 | 26G | 12 | 179,878 | 2 | 26G | 12 | 185,286 |
| Budget Analyst | 2 | 22G | 12 | 152,588 | 2 | 22G | 12 | 157,165 |
| Manager, Grants | 1 | 28G | 12 | 97,656 | 1 | 28G | 12 | 100,589 |
| Grants Analyst | 2 | 22G | 12 | 152,588 | 2 | 22G | 12 | 157,165 |
| Chief Procurement Officer | 1 | 133,827 | 12 | 133,827 | — | 137,842 | — | — |
| Assistant Director - Procurement | — | 32G | — | — | 1 | 32G | 12 | 117,458 |
| Senior Sourcing Specialist | 2 | 26G | 12 | 179,878 | 2 | 26G | 12 | 185,286 |
| Sourcing Specialist | 3 | 20G | 12 | 210,600 | 3 | 20G | 12 | 216,902 |
| Sustainable Procurement Specialist | 1 | 20G | 12 | 70,200 | 1 | 20G | 12 | 72,301 |
| Procurement Coordinator | 1 | 17G | 12 | 61,922 | 1 | 17G | 12 | 63,773 |
| Senior Manager, Fleet Services | 1 | 30G | 12 | 105,498 | — | 30G | — | — |
| Manager, Fleet Services | — | 27G | — | — | 1 | 27G | 12 | 96,554 |
| Fleet Contract Administrator | 1 | 23G | 12 | 79,352 | 1 | 23G | 12 | 81,723 |
| Fleet Operations Manager | — | 20G | — | — | 1 | 20G | 12 | 72,301 |
| Fleet Coordinator | 1 | 17G | 12 | 61,922 | 1 | 17G | 12 | 63,773 |
| Manager, Business Diversity | 1 | 26G | 12 | 89,939 | 1 | 26G | 12 | 92,643 |
| Business Diversity Coordinator | 1 | 24G | 12 | 82,742 | 1 | 24G | 12 | 85,218 |
| Contract Compliance Analyst | 1 | 16G | 12 | 59,301 | 1 | 16G | 12 | 61,090 |
| Total Full Time Permanent Positions | 30 | 2,569,212 | 31 | 2,686,066 |
Lists authorized positions with FTE counts and pay grades.
| Title | 2026 FTE | Rate/ Grade | Hours/ Months | 2026 Budget | 2027 FTE | Rate/ Grade | Hours/ Months | 2027 Budget |
|---|---|---|---|---|---|---|---|---|
| Temporary, Part-Time, and Seasonal Allowances | ||||||||
| Intern | — | varies | — | 5,000 | — | varies | — | 5,000 |
| — | 5,000 | — | 5,000 | |||||
| Total Full Time Permanent Positions | 30 | 2,569,212 | 31 | 2,686,066 | ||||
| Temporary, Part-Time, and Seasonal Allowances | — | 5,000 | — | 5,000 | ||||
| Vacancy Allowance | — | (111,763) | — | — | ||||
| Total Full-time Positions and Net Salaries | 30 | 2,462,449 | 31 | 2,691,066 |
Community Development positions are described in the appropriate Trust Fund section.
Subclass Detail
Compares actual, budgeted, and proposed spending across fiscal years.
| 2025 Actual | 2026 Budget | 2027 Budget | Increase/ (Decrease) | % Change | |
|---|---|---|---|---|---|
| Expenditures | |||||
| 51 - PERSONNEL-SALARIES & WAGES | 2,638,468 | 2,462,451 | 2,703,316 | 240,865 | 9.8% |
| 51101 - Regular | 2,624,519 | 2,457,451 | 2,686,064 | 228,613 | |
| 51103 - Part Time | — | 5,000 | 5,000 | — | |
| 51207 - Leave Buyback | 13,949 | — | 12,252 | 12,252 | |
| 52 - PERSONNEL-EMPLOYEE BENEFITS | 654,868 | 618,931 | 688,789 | 69,858 | 11.3% |
| 52101 - Health Insurance | 316,851 | 316,400 | 362,946 | 46,546 | |
| 52111 - Other Insurance/Benefits | 51,089 | 44,737 | 48,156 | 3,420 | |
| 52201 - Social Security | 199,550 | 194,174 | 211,841 | 17,667 | |
| 52601 - Personal Leave Buyback | 68,176 | 62,620 | 65,846 | 3,226 | |
| 52602 - Tuition Reimbursement | 19,202 | 1,000 | — | (1,000) | |
| 53 - PROFESSIONAL & TECHNICAL SERVICES | 1,777,745 | 791,563 | 813,379 | 21,816 | 2.8% |
| 53101 - Administrative Fees | 417,711 | 462,338 | 469,938 | 7,600 | |
| 53301 - Workforce Training | 9,981 | 36,037 | 17,500 | (18,537) | |
| 53501 - Auditing & Accounting Services | 7,000 | — | — | — | |
| 53509 - Computer Maintenance | 231,964 | 255,088 | 277,941 | 22,853 | |
| 53725 - Maintenance-Miscellaneous | 26,513 | 38,100 | 48,000 | 9,900 | |
| 53901 - Professional Services | 1,084,576 | — | — | — | |
| 54 - PROPERTY SERVICES | 8,588,525 | 9,265,214 | 9,655,355 | 390,141 | 4.2% |
| 54101 - Cleaning | 10 | 3,400 | 3,400 | — | |
| 54201 - Maintenance | 8,009,532 | 8,211,206 | 8,533,955 | 322,749 | |
| 54501 - Land & Buildings | 466,184 | 924,608 | 991,999 | 67,391 | |
| 54513 - Machinery & Equipment | 112,800 | 126,000 | 126,000 | — | |
| 55 - OTHER SERVICES | 719,358 | 836,897 | 940,296 | 103,399 | 12.4% |
| 55101 - Insurance Premiums | 716,880 | 834,397 | 937,796 | 103,399 | |
| 55309 - Regulatory | 2,437 | 2,500 | 2,500 | — | |
| 56 - SUPPLIES | 7,689,242 | 9,499,839 | 9,393,628 | (106,211) | (1.1)% |
| 56101 - Office Supplies | 1,554 | 8,000 | 8,000 | — | |
| 56105 - Postage | — | 100 | 100 | — | |
| 56151 - Operational Supplies | 3,028 | 12,640 | 12,640 | — | |
| 56201 - Fuel | 3,398,864 | 3,594,325 | 3,794,425 | 200,100 | |
| 56401 - Materials | 12,462 | 11,000 | 11,000 | — | |
| 56501 - Parts | 4,273,334 | 5,873,774 | 5,567,463 | (306,311) | |
| 57 - PROPERTY | 768 | 1,000 | 1,000 | — | —% |
| 57571- Furniture & Fixtures | 768 | 1,000 | 1,000 | — | |
| Expenditures | |||||
| 58 - MISCELLANEOUS | 1,955 | 24,000 | 24,000 | — | —% |
| 58101 - Grants | 1,955 | 24,000 | 24,000 | — | |
| 91 - TRANSFERS OUT | — | — | 6,800,000 | 6,800,000 | n/a |
| 91106 - General Fund-Out | — | — | 6,800,000 | 6,800,000 | |
| Expenditures Total | 22,070,929 | 23,499,895 | 31,019,763 | 7,519,867 | 32.0% |
Subclass Detail
91106 - General Fund-Out is broken down as follows:
• Housing Issuance: $2,500,000
• Land Bank: $300,000
• Neighborhood Business Support: $700,000
• Housing and URA Programming: $3,000,000
• URA Personnel: $300,000
Five Year Forecast
OFFICE MANAGEMENT AND BUDGET 2027 Expenditures by Subclass
51 - PERSONNEL-SALARIES & WAGES 91 - TRANSFERS OUT 52 - PERSONNEL-EMPLOYEE BENEFITS 53 - PROF. & TECHNICAL SERVICES 58 - MISCELLANEOUS 57 - PROPERTY
54 - PROPERTY SERVICES
Projects budget figures across multiple future years.
| 2027 | 2028 | 2029 | 2030 | 2031 | |
|---|---|---|---|---|---|
| Expenditures | |||||
| 51 - PERSONNEL-SALARIES & WAGES | 2,703,316 | 2,732,547 | 2,759,810 | 2,787,310 | 2,815,171 |
| 52 - PERSONNEL-EMPLOYEE BENEFITS | 688,789 | 703,465 | 718,289 | 733,529 | 736,840 |
| 53 - PROF. & TECHNICAL SERVICES | 813,379 | 825,294 | 836,952 | 848,953 | 861,316 |
| 54 - PROPERTY SERVICES | 9,655,355 | 10,046,777 | 10,420,960 | 10,468,987 | 10,521,817 |
| 55 - OTHER SERVICES | 940,296 | 987,186 | 1,036,420 | 1,043,574 | 1,046,946 |
| 56 - SUPPLIES | 9,393,628 | 9,097,001 | 9,310,543 | 9,310,543 | 9,310,543 |
| 57 - PROPERTY | 1,000 | 1,000 | 1,000 | 1,000 | 1,000 |
| 58 - MISCELLANEOUS | 24,000 | 24,000 | 24,000 | 24,000 | 24,000 |
| 91 - TRANSFERS OUT | 6,800,000 | 6,800,000 | 6,800,000 | 6,800,000 | 6,800,000 |
| Total | 31,019,763 | 31,217,270 | 31,907,974 | 32,017,896 | 32,117,633 |
| % Change from Prior Year | 32.0% | 0.6% | 2.2% | 0.3% | 0.3% |