Department of Innovation and Performance
Section 13 · Pages 76–83 · 4 tables · includes narrative
Key changes
- Reduces by 1 position (75 → 74 FTE)
On this page
Department of Innovation and Performance
 Department of Innovation and Performance
Mission
The mission of the Department of Innovation & Performance (I&P) is to elevate the work of City government. To accomplish this, I&P continues to focus on developing and strengthening the core IT infrastructure of the city while also improving IT service responsiveness for all City workers. I&P will also continue supporting other departments to implement enterprise applications, data governance and digital services. Further, I&P engages and partners with colleagues across all departments to drive innovation, performance improvement and operational excellence across the city on behalf of the residents of Pittsburgh.
Departmental/Bureau Overview
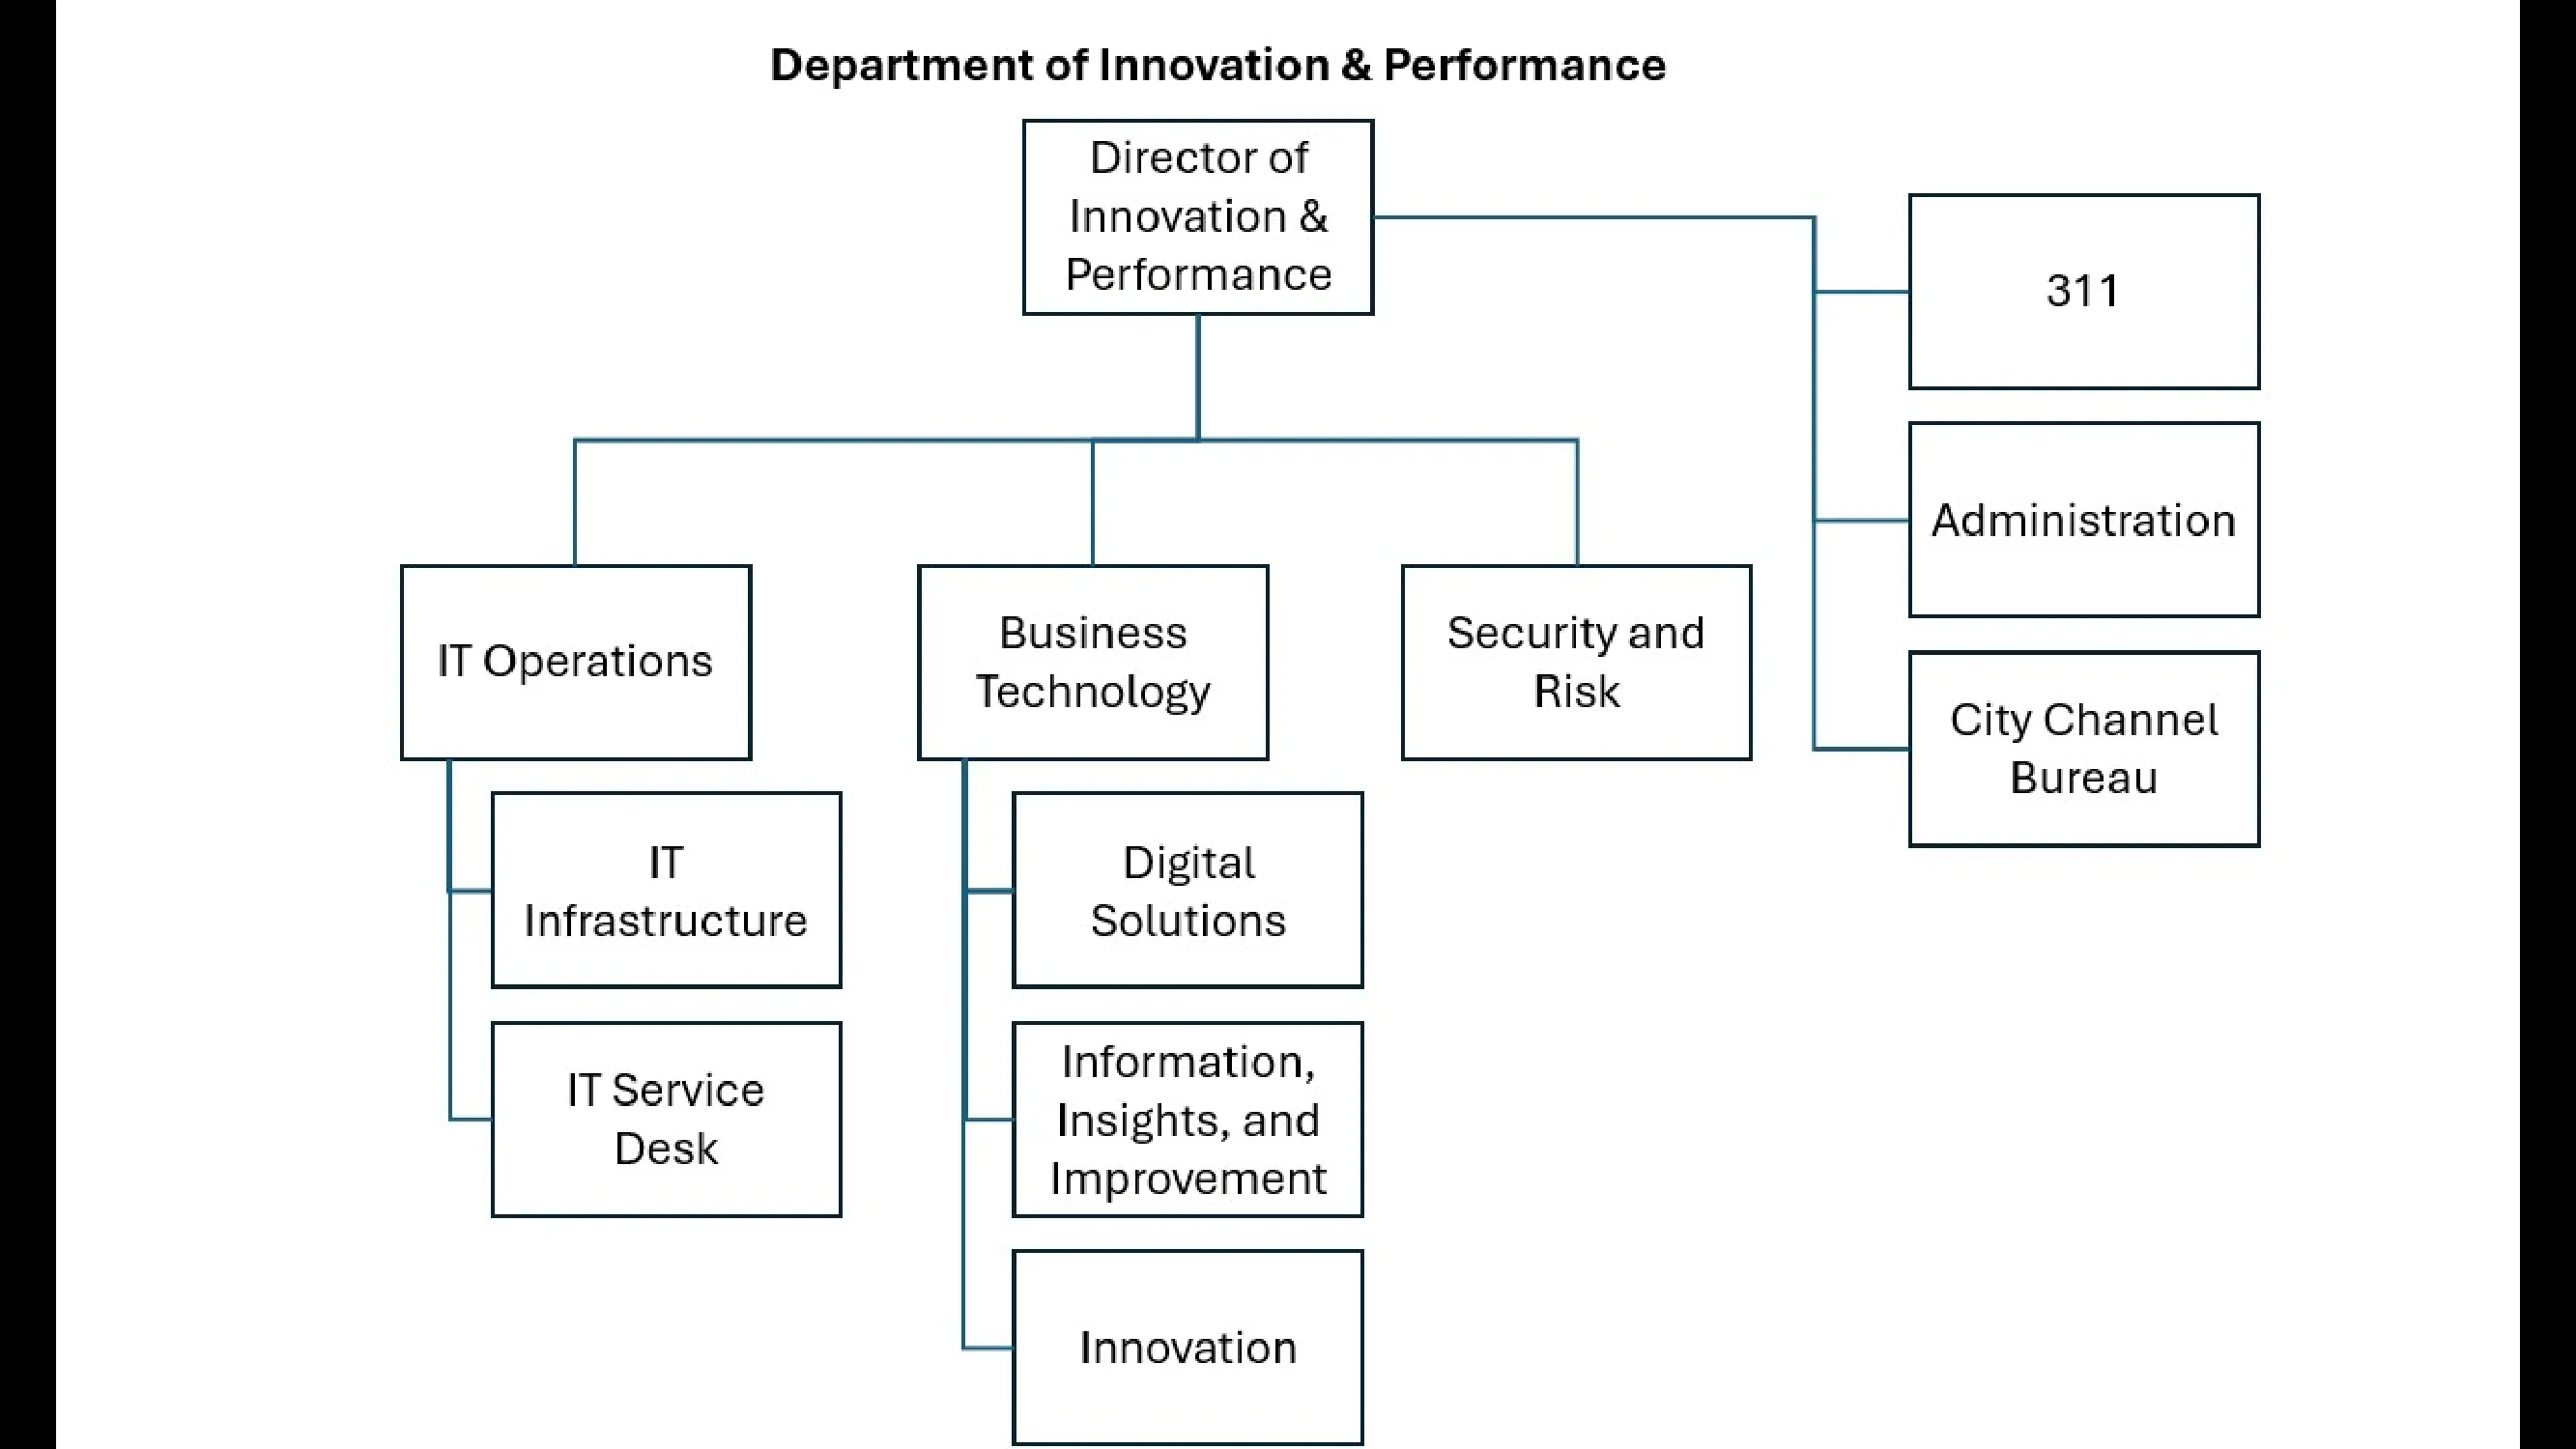
The Department of Innovation & Performance is divided into the following six service teams: Business Technology - supports enterprise applications, geospatial information systems, digital communications media, data engineering and analytics, digital city services, and performance excellence training and support. Within Business Technology, the Innovation team is responsible for IT project management, business relationship management, technology training support, and civic innovation, such as the award-winning PGH Lab program and innovation partnerships with local universities.
Security and Risk - responsible for cybersecurity risk assessments and the application of best practices to mitigate and remediate identified threats.
IT Operations Reliability – maintains core IT infrastructure, systems administration, network engineering and key IT infrastructure improvement projects. In addition, the I&P Service Desk fulfills internal requests for computing devices and resolves IT-related incidents for City of Pittsburgh employees.
City Cable Bureau - the official city government cable television bureau for the City of Pittsburgh. Cablecast on Comcast Channel 14 & 1074, and Verizon Channel 44, the City Channel regularly airs live and replayed City Council meetings, public hearings, post-agendas, and budget hearings.
I&P Administration - responsible for the policies, finances, human resources and administration of the department.
2026 Accomplishments
Technology Modernization:
- Expanded digital government capabilities including self-service website chatbot and digital accessibility. Launched AI strategy and change management training with a PGH Lab partnership with local veteran- owned company, The Orange Peel Collaborative. Advanced Citywide Enterprise Resource Planning (ERP) modernization efforts through vendor evaluations, stakeholder engagement, and implementation planning.
- Launched Universal Communications as a Service (UCAAS). Call Centers will be onboarded to replacement of current communication services provider by the end of October. Completed plan to migrate City County Building to UCAAS in 2027, responding to telecommunications utility retirement of telephone communications services platform.
- Launched a migration of City facilities to its new fiber network, eliminating recurring costs previously paid to telecommunications companies for internet service and resolving connection instability experienced in some locations. This upgrade delivered increased bandwidth, improving overall network performance and operational efficiency across the City's footprint. Supporting Permit Reform:
- Completed addressing modernization design and public-facing dashboards. On target to launch Housing Dashboard with Departments of City Planning (DCP) and Department of Permits, Licenses, and Inspections (PLI) and Permitting Dashboard with DCP, PLI, and the Department of Mobility and Infrastructure (DOMI) by the end of 2026. Supporting Core City Services: 78
- Maintained operational readiness by supporting the 2026 NFL Draft, onboarding Zone 5 and Fire 8 while planning technology outfitting for DPW Division 4 and Fire 20/Medic 12, and mapping snow routes with iPad procurement underway to meet 2026-27 snow season needs.
- Supported government transparency by producing, televising, streaming, and replaying approximately 150 City Council meetings annually, plus hundreds of board and commission meetings, community meetings, press conferences, ceremonies, trainings, and promotional content for City departments. Maintained and upgraded the studio, control room, engineering systems, and Council Chamber to meet increasing demand.
Position Summary
Lists authorized positions with FTE counts and pay grades.
| Title | 2026 FTE | Rate/ Grade | Hours/ Months | 2026 Budget | 2027 FTE | Rate/ Grade | Hours/ Months | 2027 Budget |
|---|---|---|---|---|---|---|---|---|
| I&P Administration | ||||||||
| Director of Innovation & Performance/Chief Information Officer | 1 | 35G | 12 | 132,995 | 1 | 35G | 12 | 136,989 |
| Administration Manager | 1 | 27G | 12 | 93,746 | 1 | 27G | 12 | 96,554 |
| Senior Fiscal Administrator | 1 | 70,377 | 12 | 70,377 | 1 | 72,489 | 12 | 72,489 |
| Chief Clerk 1 | 1 | 16G | 12 | 59,301 | 1 | 19G | 12 | 69,306 |
| Coordinator, Administrative | 1 | 49,500 | 12 | 49,500 | 1 | 50,985 | 12 | 50,985 |
| IT Operations Reliability | ||||||||
| Assistant Director - IT Operations | 1 | 32G | 12 | 114,046 | 1 | 32G | 12 | 117,458 |
| Senior Manager, IT Service Desk | 1 | 29G | 12 | 101,525 | 1 | 29G | 12 | 104,562 |
| Assistant Manager, IT Service Desk | 1 | 24G | 12 | 82,742 | 1 | 24G | 12 | 85,218 |
| Technology Analyst | 2 | 23G | 12 | 158,704 | 2 | 23G | 12 | 163,446 |
| Senior Analyst, IT Service | 1 | 71,414 | 12 | 71,414 | 1 | 73,556 | 12 | 73,556 |
| Analyst, IT Service | 4 | 65,518 | 12 | 262,072 | 4 | 67,483 | 12 | 269,933 |
| Senior Manager, IT Infrastructure | 1 | 29G | 12 | 101,525 | 1 | 29G | 12 | 104,562 |
| Senior Systems Administrator | 1 | 27G | 12 | 93,746 | 1 | 27G | 12 | 96,554 |
| Systems Administrator | 2 | 23G | 12 | 158,704 | 2 | 23G | 12 | 163,446 |
| Network Engineer | 3 | 25G | 12 | 258,024 | 3 | 25G | 12 | 265,762 |
| Technician, Network | 2 | 67,510 | 12 | 135,020 | 2 | 69,535 | 12 | 139,070 |
| Security & Risk | ||||||||
| Assistant Director, Security/Chief Information Security Officer | 1 | 33G | 12 | 120,827 | 1 | 33G | 12 | 124,446 |
| Cybersecurity Engineer | 1 | 25G | 12 | 86,008 | 2 | 25G | 12 | 177,174 |
| Noble Reach Fellow in Cybersecurity | 1 | 23G | 10 | 66,127 | — | 23G | — | — |
| Information Security Analyst | — | 23G | — | — | 1 | 23G | 12 | 81,723 |
| Operations Performance Excellence | ||||||||
| Manager, Operations Performance Excellence | 1 | 27G | 12 | 93,746 | — | 27G | 12 | — |
| Process Improvement Engineer | 2 | 25G | 12 | 172,016 | 2 | 25G | 12 | 177,174 |
| Business Technology | ||||||||
| Assistant Director - Business Technology | 1 | 32G | 12 | 114,046 | 1 | 32G | 12 | 117,458 |
| Senior Manager, Digital Services/Chief Data Officer | 1 | 29G | 12 | 101,525 | 1 | 29G | 12 | 104,562 |
| Senior Data Services Engineer | 1 | 25G | 12 | 86,008 | 1 | 25G | 12 | 88,587 |
| Data Services Engineer | 1 | 23G | 12 | 79,352 | 1 | 23G | 12 | 81,723 |
| Senior Data Analyst | 1 | 25G | 12 | 86,008 | 1 | 25G | 12 | 88,587 |
| Data Analyst | — | 23G | — | — | 2 | 23G | 12 | 163,446 |
| Operational Performance Analyst | 1 | 23G | 12 | 79,352 | — | 23G | — | — |
| Database Administrator | 1 | 27G | 12 | 93,746 | 1 | 27G | 12 | 96,554 |
| Senior Manager, Innovation | 1 | 29G | 12 | 101,525 | 1 | 29G | 12 | 104,562 |
| Senior Project Coordinator | 2 | 21G | 12 | 146,515 | — | 21G | — | — |
| Technical Project Manager | — | 25G | — | — | 1 | 25G | 12 | 88,587 |
| Technology Implementation Specialist | 1 | 20G | 12 | 70,200 | 1 | 20G | 12 | 72,301 |
| Business Relationship Manager | 4 | 25G | 12 | 344,032 | 3 | 25G | 12 | 265,762 |
| Senior Business Technology Analyst | — | 25G | — | — | 1 | 25G | 12 | 88,587 |
| Civic Technology & Policy Analyst | 1 | 20G | 12 | 70,200 | 1 | 20G | 12 | 72,301 |
| Civic Innovation Specialist | 2 | 20G | 12 | 140,400 | 2 | 20G | 12 | 144,602 |
| Senior Manager, Applications | 1 | 29G | 12 | 101,525 | 1 | 29G | 12 | 104,562 |
| Senior Enterprise Applications Administrator | 3 | 25G | 12 | 258,024 | 4 | 25G | 12 | 354,349 |
| Enterprise Applications Administrator | 2 | 23G | 12 | 158,704 | 1 | 23G | 12 | 81,723 |
| G.I.S. Administrator | 1 | 26G | 12 | 89,939 | 1 | 26G | 12 | 92,643 |
| G.I.S. Coordinator | 1 | 23G | 12 | 79,352 | 1 | 23G | 12 | 81,723 |
| Analyst, G.I.S. | 1 | 72,931 | 12 | 72,931 | 1 | 75,119 | 12 | 75,119 |
| Analyst, G.I.S. | 1 | 69,307 | 12 | 69,307 | 1 | 71,386 | 12 | 71,386 |
| Website Administrator | 1 | 26G | 12 | 89,939 | 1 | 26G | 12 | 92,643 |
| Communications Design Administrator | 1 | 24G | 12 | 82,742 | 1 | 24G | 12 | 85,218 |
| Web Developer | 1 | 24G | 12 | 82,742 | — | 24G | — | — |
| Digital Communication Administrator | — | 24G | — | — | 1 | 24G | 12 | 85,218 |
| Noble Reach Fellow in AI/Data Services | 1 | 23G | 10 | 66,127 | — | 23G | — | — |
| Communications | ||||||||
| Communication Technology Manager | 1 | 27G | 12 | 93,746 | 1 | 27G | 12 | 96,554 |
| Editor/Videographer | 4 | 57,462 | 12 | 229,848 | 4 | 59,186 | 12 | 236,746 |
| Coordinator, Print Shop | 1 | 65,517 | 12 | 65,517 | 1 | 67,483 | 12 | 67,483 |
| Manager, 311 Response Line | 1 | 25G | 12 | 86,008 | 1 | 25G | 12 | 88,587 |
| Assistant Manager, 311 Response Line | 1 | 22G | 12 | 76,294 | 1 | 22G | 12 | 78,582 |
| Performance Operations Analyst | 1 | 20G | 12 | 70,200 | 1 | 20G | 12 | 72,301 |
| 311 Call Center Representative | 4 | 47,250 | 12 | 189,000 | 4 | 48,460 | 12 | 193,839 |
| Total Full-Time Permanent Positions | 75 | 5,957,019 | 74 | 6,106,702 |
Position Summary
Lists authorized positions with FTE counts and pay grades.
| Title | 2026 FTE | Rate/ Grade | Hours/ Months | 2026 Budget | 2027 FTE | Rate/ Grade | Hours/ Months | 2027 Budget |
|---|---|---|---|---|---|---|---|---|
| Temporary, Part-Time, and Seasonal Allowances | ||||||||
| Graphics and Print Technician | — | 28.91 | 1,247 | 35,951 | — | 29.78 | 1,247 | 37,136 |
| 311 Call Center Representative | — | 22.72 | — | 92,432 | — | 23.30 | — | 95,205 |
| I&P Intern | — | 15.00 | — | 34,000 | — | 15.00 | — | 34,000 |
| Cybersecurity Fellow | — | 18.00 | — | 18,000 | — | 18.00 | — | 18,000 |
| — | 180,383 | — | 184,341 | |||||
| Total Full-Time Permanent Positions | 75 | 5,957,019 | 74 | 6,106,702 | ||||
| Temporary, Part-Time, and Seasonal Allowances | — | 180,383 | — | 184,341 | ||||
| Vacancy Allowance | — | (325,049) | — | (183,201) | ||||
| Total Full-time Positions and Net Salaries | 75 | 5,812,353 | 74 | 6,107,842 |
Subclass Detail
Compares actual, budgeted, and proposed spending across fiscal years.
| 2025 Actual | 2026 Budget | 2027 Budget | Increase/ (Decrease) | % Change | |
|---|---|---|---|---|---|
| Expenditures | |||||
| 51 - PERSONNEL-SALARIES & WAGES | 5,079,794 | 5,855,953 | 6,175,562 | 319,609 | 5.5% |
| 51101 - Regular | 4,982,175 | 5,631,969 | 5,923,498 | 291,529 | |
| 51103 - Part-Time | 36,483 | 180,383 | 184,341 | 3,958 | |
| 51201 - Longevity | — | 4,500 | 12,500 | 8,000 | |
| 51207 - Leave Buyback | 9,938 | — | 16,123 | 16,123 | |
| 51401 - Premium Pay | 51,198 | 39,101 | 39,101 | — | |
| 52 - PERSONNEL-EMPLOYEE BENEFITS | 1,204,742 | 1,553,270 | 1,790,562 | 237,292 | 15.3% |
| 52101 - Health Insurance | 632,060 | 862,936 | 1,052,814 | 189,878 | |
| 52111 - Other Insurance/Benefits | 100,170 | 106,254 | 114,463 | 8,208 | |
| 52201 - Social Security | 362,039 | 460,050 | 496,134 | 36,084 | |
| 52601 - Personal Leave Buyback | 110,474 | 104,030 | 107,151 | 3,121 | |
| 52602 - Tuition Reimbursement | — | 20,000 | 20,000 | — | |
| 53 - PROFESSIONAL & TECHNICAL SERVICES | 9,657,426 | 10,295,083 | 10,637,986 | 342,903 | 3.3% |
| 53101 - Administrative Fees | 3,512 | — | — | — | |
| 53105 - Recording/Filing Fees | 11,042 | 8,000 | — | (8,000) | |
| 53301 - Workforce Training | 96,613 | 188,500 | 178,000 | (10,500) | |
| 53509 - Computer Maintenance | 8,659,813 | 9,457,783 | 9,914,186 | 456,403 | |
| 53529 - Protective/Investigation | 7,465 | 7,000 | 7,000 | — | |
| 53701 - Repairs | 545 | 40,000 | 40,000 | — | |
| 53901 - Professional Services | 878,437 | 593,800 | 498,800 | (95,000) | |
| 54 - PROPERTY SERVICES | 77,307 | 71,500 | 71,500 | — | —% |
| 54103 - Disposal-Refuse | 7,727 | 15,000 | 15,000 | — | |
| 54513 - Machinery & Equipment | 69,580 | 56,500 | 56,500 | — | |
| 55 - OTHER SERVICES | 3,332,144 | 3,532,146 | 3,767,708 | 235,562 | 6.7% |
| 55201 - Telephone | 2,446,184 | 3,030,146 | 2,925,708 | (104,438) | |
| 55501 - Printing & Binding | 884,923 | 500,000 | 840,000 | 340,000 | |
| 55701 - Transportation | 1,037 | 2,000 | 2,000 | — | |
| 56 - SUPPLIES | 160,277 | 107,500 | 203,250 | 95,750 | 89.1% |
| 56101 - Office Supplies | 48,250 | 50,000 | 50,000 | — | |
| 56103 - Freight Charges | 90 | — | — | — | |
| 56151 - Operational Supplies | 111,937 | 55,500 | 151,250 | 95,750 | |
| 56401 - Materials | — | 2,000 | 2,000 | — | |
| 57 - PROPERTY | 1,159,900 | 844,000 | 289,000 | (555,000) | (65.8)% |
| 57501 - Machinery & Equipment | 1,159,900 | 844,000 | 289,000 | (555,000) | |
| 91 - TRANSFERS-OUT | — | — | 3,515,961 | 3,515,961 | n/a |
| 91106 - General Fund - Out | — | — | 3,515,961 | 3,515,961 | |
| 20,671,590 | 22,259,453 | 26,451,529 | 4,192,077 | 18.8% |
Five Year Forecast
DEPARTMENT OF INNOVATION AND PERFORMANCE 2027 Expenditures by Subclass
57 - PROPERTY 56 - SUPPLIES 51 - PERSONNEL-SALARIES & WAGES 55 - OTHER SERVICES 54 - PROPERTY SERVICES
52 - PERSONNEL-EMPLOYEE BENEFITS
Projects budget figures across multiple future years.
| 2027 | 2028 | 2029 | 2030 | 2031 | |
|---|---|---|---|---|---|
| Expenditures | |||||
| 51 - PERSONNEL-SALARIES & WAGES | 6,175,562 | 6,267,854 | 6,338,231 | 6,400,322 | 6,463,788 |
| 52 - PERSONNEL-EMPLOYEE BENEFITS | 1,790,562 | 1,835,491 | 1,879,341 | 1,923,661 | 1,930,936 |
| 53 - PROF. & TECHNICAL SERVICES | 10,637,986 | 11,309,635 | 11,410,197 | 11,470,759 | 11,587,338 |
| 54 - PROPERTY SERVICES | 71,500 | 72,000 | 72,000 | 72,000 | 72,000 |
| 55 - OTHER SERVICES | 3,767,708 | 3,793,940 | 3,732,140 | 3,732,140 | 3,732,140 |
| 56 - SUPPLIES | 203,250 | 204,250 | 204,250 | 204,250 | 204,250 |
| 57 - PROPERTY | 289,000 | 489,000 | 489,000 | 489,000 | 489,000 |
| 91 - TRANSFERS-OUT | 3,515,961 | 1,903,754 | — | — | — |
| Total | 26,451,530 | 25,875,923 | 24,125,160 | 24,292,132 | 24,479,451 |
| % Change from Prior Year | 18.8% | (2.2)% | (6.8)% | 0.7% | 0.8% |